
This time last year, South West Water trumpeted their ‘success’ in “reducing overflows by 50% and their duration by 75%”. We pointed out at that time that this statement was highly disingenuous, as any apparent ‘success’ was almost certainly caused by 2022 having 25% lower rainfall than average – and that they would need to take real action in order to bring sewage discharges down.
Well today, the results of that underinvestment were made clear.
Five of Budleigh’s eight sewage overflows were in full flow in 2023, with 187 incidents discharging 546 hours of sewage into our town streams and beach area. This represents a more than tripling of the number of events, and almost doubling of the discharge time, compared to 2022.
It sometimes seems that SWW focus more on spinning the news than tackling the underlying issues, so it will be interesting to see how they approach today’s shocking figures.
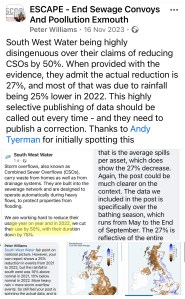
One item they’ve already trailed as a reason for the poor performance is the rainfall in 2023. They are talking about ‘exceptional’ rainfall, ‘which clearly they couldn’t plan for’ …. except that’s really not the case. The south west area rainfall in 2023 was not significantly different to the 2015-2022 pattern, and it was 2022 which was the outlier (approx 25% less rainfall compared to average years). As can be seen from the Met Office rainfall charts below, the South West had about 1,200mm rain in 2023, slightly less in 2021, and about 900mm in 2021.
So yes, 2023 was wetter than the previously very dry year, but that should not trigger a doubling of sewage into our local environment. It’s also worth noting that rainfall variation does not change the water companies legal obligations to achieve the Government-set discharge targets.
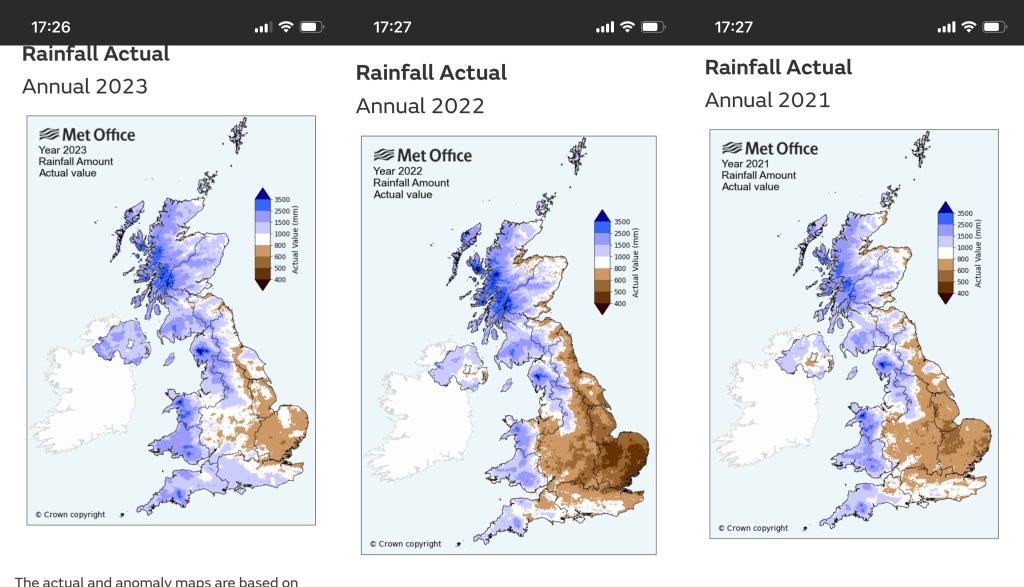
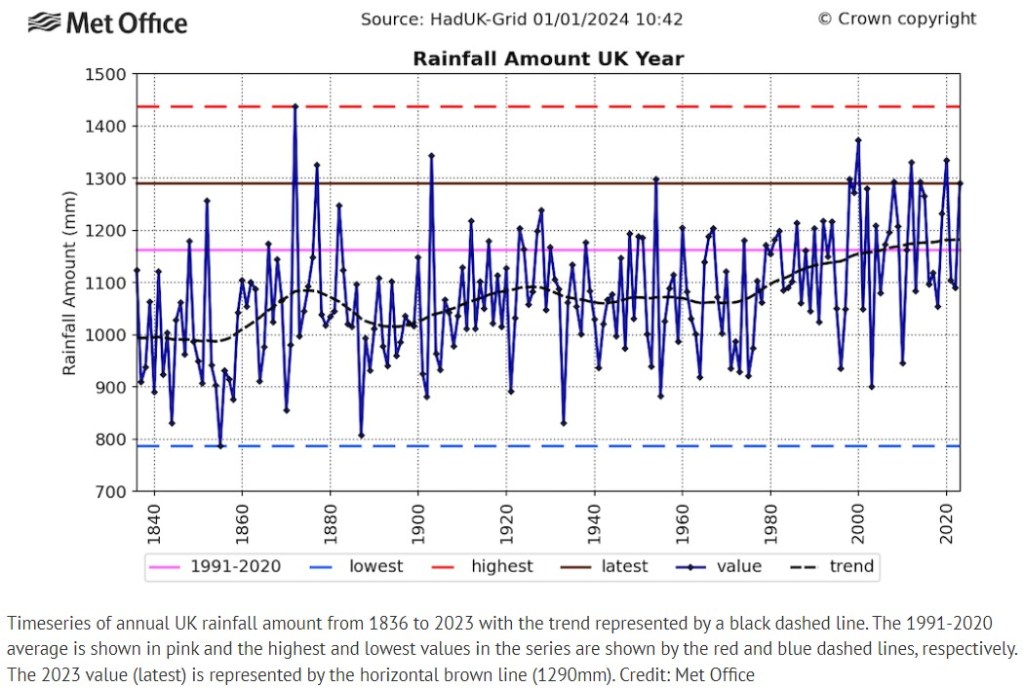
South West Water, and the Environment Agency, like to quote rainfall comparisons to the 30-year ‘Long Term Average’, and on that basis 2023 was a wetter year. The problem with that argument is that the UK is going through a sustained period of increasing rainfall. So justifying poor discharge performance on the basis of outdated averages just won’t cut it in future.
The largest single polluter remains the Lime Kiln Pumping Station, where 116 discharges dumped sewage for a total of 466 hours. That’s a discharge every three days on average. If South West Water want to make a major improvement in Budleigh’s water quality, they really must address the critical issues at Lime Kiln pumping station. As it’s built on a large car park, there can be no excuse for not having the space to significantly increase sewage holding capacity (so called storm tanks).
Lime Kiln actually has two sewage outlets. One goes out to Otter ledge, but the Emergency Overflow (which we know they did use in 2023) dumps raw sewage straight into the Kersbrook and from there directly into the sea. As both outfalls are covered by a single data point, we don’t know how much of that was dumped onto the shoreline, and how much was slightly further offshore. This lack of clarity really needs to change.
SWW’s pollution performance in Budleigh is fairly typical of their dire performance across the region. 2023 saw a shocking 1/2 million hours of sewage being discharged from SWW’s overflows, an increase of 88% on 2022.
Looking across the broader River Otter catchment area (which all flows out alongside Budleigh beach), there were more than a thousand pollution events in 2023, discharging over seven thousand hours of sewage into the river. Again, this was around 40% higher than in 2022.
This data highlights why we need SWW to take real action now, particularly to sort out the Lime Kiln sewage problems. No ‘spinning’, no excuses.

Leave a comment